![]()
![]()
Facts
Data and maps
16th October 2024
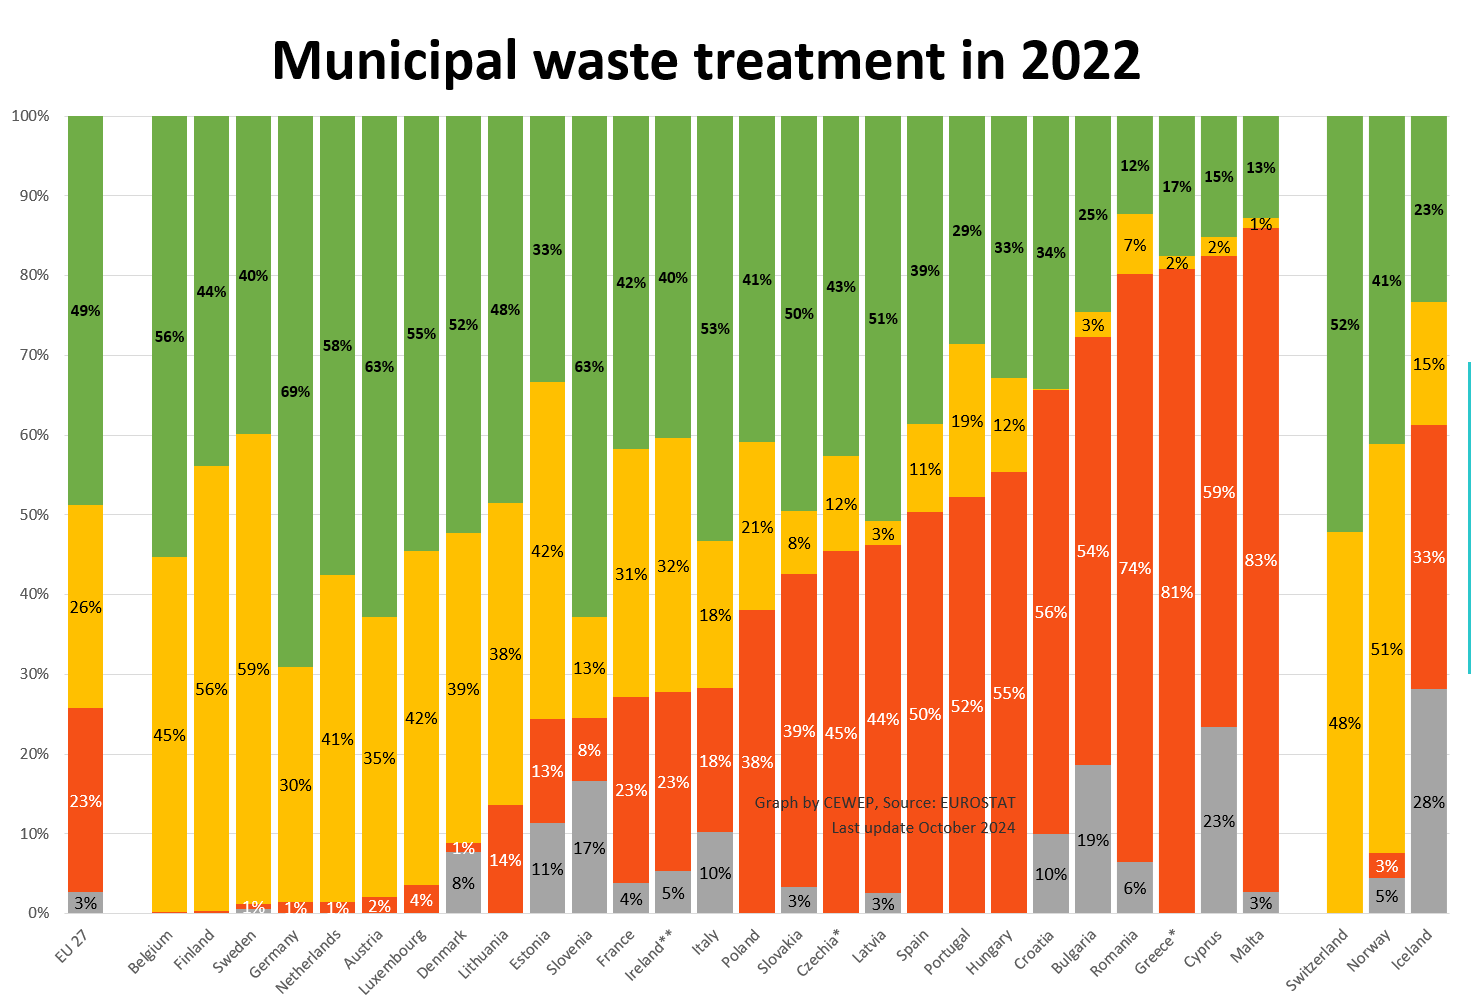
Each year after publication of the Eurostat figures for Municipal Waste Treatment, CEWEP produces many graphs based on this data in order to show the state of waste treatment in Europe.
This particular graph shows the share of recycling (including composting), Waste-to-Energy and landfilling of municipal waste in each EU Member State (plus Norway, Switzerland and Iceland), sorted by share of landfilling. It also displays the missing data, which includes the gaps between the waste generated in the country and the waste treated.
In 2022 the leading country for recycling was Germany, with 69% of municipal waste either recycled or composted. While 9 Member States (including Slovenia, which shows a 17% gap between waste treated and waste generated) landfilled less than 10 % of their waste – which is the target set by the new Landfill Directive for 2035 – 9 Member States still landfilled more than 50 % of their municipal waste.
The graph can be downloaded here or by clicking on the picture below. Last update: 16th October 2024